
Netra Kernel: Open-Source ROCm Kernels for AMD MI350X
Inside our open-source raw AMDGCN kernel repository for Qwen3.6 inference on AMD MI350X, including the engineering behind 81.33K output tokens/s.
Netra Kernel: open-source ROCm kernels for AMD GPU inference
Netra Kernel is the public implementation behind this article. It is a target-specific kernel laboratory for AMD GPU inference, not a portable tensor library. Compute lives in hand-written raw AMDGCN code objects; HIP and Python manage loading, dispatch, graph and workspace integration, correctness checks, benchmarking, and SGLang serving integration.
Every kernel publishes a bounded contract over GPU architecture, wave size, tensor shape, dtype, layout, quantization format, and reduction order. The repository keeps gfx950 kernels for AMD Instinct MI350X separate from gfx1151 kernels for Ryzen AI Max+, and unsupported contracts remain on the caller's established implementation.
- Browse the gfx950 kernel sources for FP8, attention, GDN, normalization, routing, and sampling paths.
- Inspect the gfx950 runtime bridges that load code objects and preserve caller-owned HIP streams.
- Run the gfx950 validation harnesses used for real-capture and synthetic correctness checks.
- Read the retained results, including positive measurements and experiments that did not pass promotion gates.
The repository is released under the MIT License. The benchmark below shows why these kernels exist and how their local gains survived graph replay, SGLang integration, routing, and complete-server validation.
Qwen3.6 MI350X benchmark results at a glance
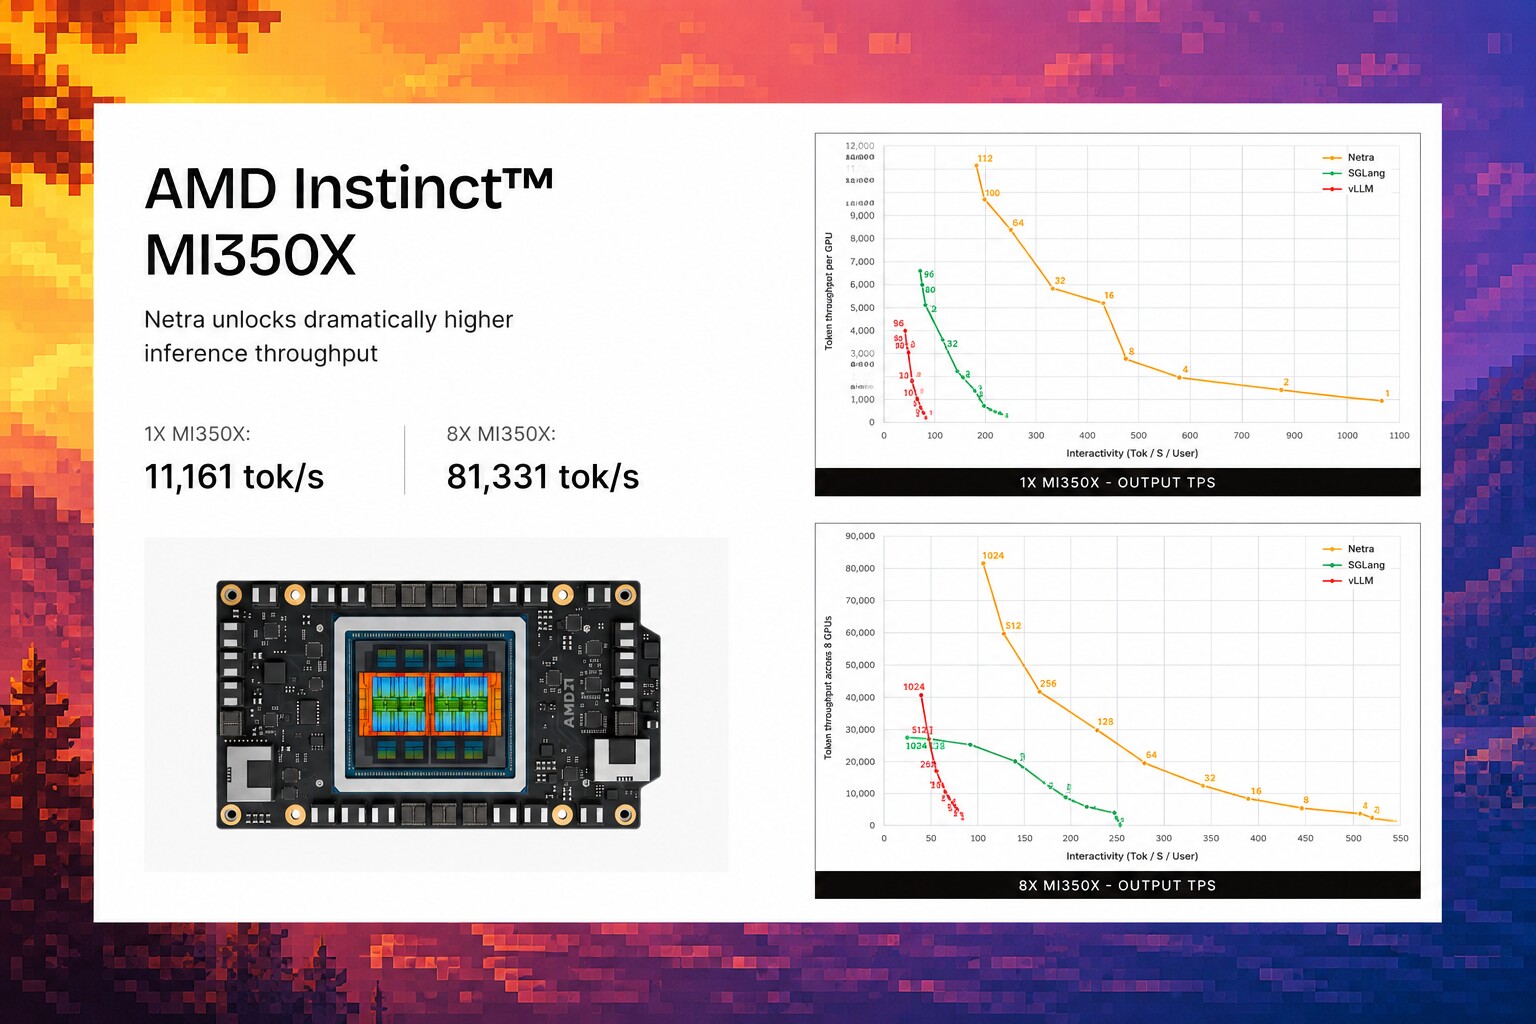
In our Qwen3.6 SGLang inference benchmark, eight AMD Instinct MI350X GPUs served Qwen3.6-35B-A3B-FP8 at 81,331.51 output tokens/s on the production 1K/1K profile. The run completed 3,072 requests at global concurrency 1,024, with exactly 3,145,728 measured input tokens and 3,145,728 measured output tokens.
That sounds like a scaling result. It is really a bottleneck story.
On one MI350X, the retained 1K/1K profile reached 11,161 output tokens/s, 1.52× base SGLang, 1.97× SGLang DFlash, and 2.38× vLLM. We got there by optimizing the hot MoE, FP8-KV attention, GDN, convolution, graph replay, and sampling paths while preserving SGLang's serving semantics.
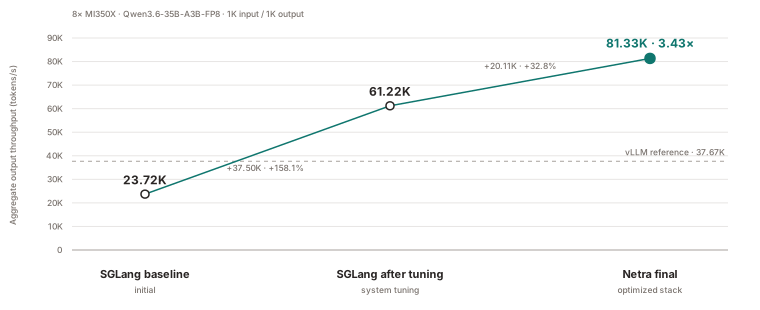
At DP8, base SGLang started at 23,718.36 output tokens/s. We tuned SGLang's scheduling, graph, batching, and runtime configuration to reach 61,222.80. With the Netra kernels and runtime path enabled, throughput reached 81,331.51; vLLM reached 37,673.90. The full result is 3.43× base SGLang, 2.16× vLLM, and 32.8% above SGLang after our tuning.
Finally, the distributed path had to preserve the local result. A single Python load generator understated routed throughput. Cumulative streaming turned an 8K generation into quadratic response traffic. Incomplete batch coverage caused recurrent-state fallbacks precisely where the scheduler was trying to fill the GPUs. Those were not peripheral issues: after the graph became fast, they were the critical path.
The optimization path runs from one GPU to eight. Inside the gfx950 kernels, arithmetic order, layout, and persistent state define correctness. At the HTTP response stream, sending the same token thousands of times can erase work saved in assembly. Across both layers, the useful unit of optimization is a bounded serving contract, not an operator name, a launch time, or a peak benchmark in isolation.
Single-GPU Qwen3.6 inference on AMD MI350X
One AMD Instinct MI350X is large enough to hold Qwen3.6-35B-A3B-FP8, its draft model, KV cache, recurrent state, CUDA/HIP graph workspaces, and the temporary buffers needed by a high-concurrency SGLang server. That changes the optimization problem. There is no tensor-parallel collective to hide and no expert exchange to overlap. Every microsecond saved or wasted belongs to one self-contained request engine.
We used that simple DP1/TP1 topology to optimize the complete Qwen3.6 serving path on gfx950. The result is not one kernel and it is not one launch flag. It is a stack of exact-shape FP8 MoE kernels, native-FP8-KV attention, recurrent GDN kernels, graph-safe runtime bridges, a tuned DFlash profile, and guarded SGLang/AITER fallbacks.
On the confirmed random 1,024-input/256-output workload, one MI350X delivered:
| Concurrency | Netra + DFlash | Base SGLang | vLLM | vs SGLang | vs vLLM |
|---|---|---|---|---|---|
| 1 | 455.42 output tok/s | 214.39 | 84.27 | 2.12× | 5.40× |
| 8 | 1,886.80 output tok/s | 1,286.79 | 587.69 | 1.47× | 3.21× |
All three systems ran on one MI350X with the same FP8 target checkpoint, random-content workload and token lengths, disabled prefix caching, and the same benchmark driver. Netra used its DFlash draft and optimized serving path; the stock baselines did not use speculative decoding. This is therefore a service-level comparison of complete engine profiles, not an isolated kernel comparison.
The newer production profiles move much more traffic on the same single GPU:
- The retained-best 1K-input/1K-output profile reached 11,161 output tokens/s.
- The best natural-output C64 serving run reached 11,517.22 output tokens/s.
- The best 1K-input/8K-output run reached 14,431.74 output tokens/s.
- On a full 1,314-example GSM8K run, the selected DFlash profile reached 3,902.92 output tokens/s at 95.43% accuracy.
The operation-level improvements underneath these results are larger still: 7.08× for exact argmax, 4.38× for split-sequence target attention, 2.21× for native-FP8-KV target attention, 2.07× for causal convolution, and 1.99× for fused MoE activation and quantization. We use these measurements to explain the system result. We do not multiply them or present them as whole-server speedups.
The transferable lesson is straightforward: profile one complete serving engine, specialize only exact contracts, preserve high-quality fallbacks, and promote only what survives end-to-end validation.
Why DP1 is the right topology
AMD Instinct MI350X is a CDNA 4 accelerator exposed by ROCm as gfx950. It provides 288 GB of HBM3E and up to 8 TB/s of on-package memory bandwidth, with native low-precision support including FP8 and MXFP4. ROCm reports 256 compute units, wave64 execution, and 160 KiB LDS per compute unit. Those dimensions matter below: 16-workgroup reductions catastrophically underfill this target, while a 64 KiB LDS tile is a deliberate per-workgroup resource commitment. See AMD's official MI350X product page and the ROCm GPU specification table. SGLang's quantization documentation also documents MI350X FP8 and MXFP4 paths, including AITER-backed operators. AMD's official Qwen3.6 deployment guide for vLLM and SGLang on Instinct GPUs provides the broader model-enablement context, while ROCm's vLLM inference performance optimization guide covers AITER, FP8/FP4, graph, batch, and parallelism tuning on the MI350 series.
For Qwen3.6-35B-A3B-FP8, that memory capacity lets one GPU own the complete model and request state:
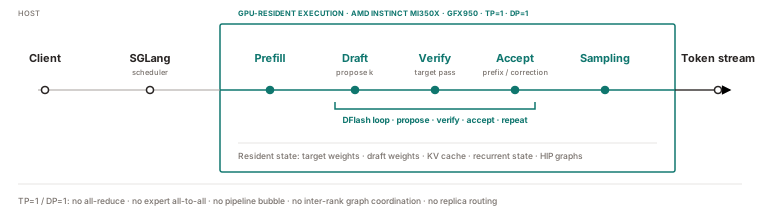
This topology removes entire classes of distributed overhead:
- no all-reduce or reduce-scatter in attention and dense layers;
- no all-to-all exchange for routed experts;
- no pipeline bubbles or cross-rank activation transfers;
- no inter-rank graph-capture coordination; and
- no replica router in the measured path.
It also makes attribution unusually clean. If a request becomes faster, the cause must be in compute, memory movement, graph execution, scheduling, or the local response path, not a change in rank balance or interconnect traffic.
The trade-off is that every kernel must utilize a very large accelerator on its own. Small decode and speculative-verification batches can expose too little parallel work. The optimization target is therefore not simply peak matrix throughput. It is efficient execution across a wide shape envelope, from one-row projections and M12 verification to M128 decode and M8192 prefill.
Profiling SGLang inference on AMD MI350X
Qwen3.6-35B-A3B combines routed mixture-of-experts layers, full attention, and gated delta network recurrence. Its steady decode graph contains several large families rather than one dominant GEMM.
For one scheduler step, we use the decomposition
where the captured graph contains target or draft model execution, sample covers reductions and token selection outside capture, host covers launch and bookkeeping, and queue accounts for synchronization and bubbles. Inside the graph,
with overlap and cache effects making the sum approximate rather than an identity. This model prevents a common attribution error. If a kernel occupies fraction of a step and is accelerated by , the idealized upper bound on whole-step speedup is
The bound becomes weaker when a replacement changes launch count, cache residency, graph packing, or the speculative trajectory. For that reason we use traces to choose work, exact-shape microbenchmarks to identify mechanisms, and complete-server A/B runs to establish the result.
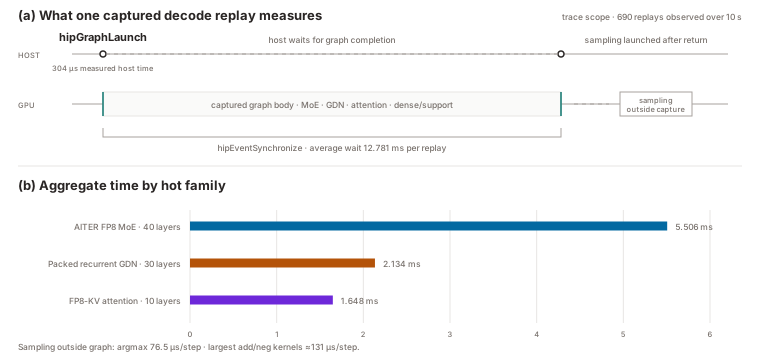
At batch 128, a representative ten-second trace captured 690 graph replays. The average hipEventSynchronize wait was 12.781 ms per replay and the host spent 304 µs in hipGraphLaunch. The graph body ranked:
| Rank | Kernel family | Aggregate time | Scope |
|---|---|---|---|
| 1 | AITER one-stage FP8 MoE main kernels | 5.506 ms | 40 layers |
| 2 | Packed recurrent GDN | 2.134 ms | 30 layers |
| 3 | AITER unified FP8-KV attention | 1.648 ms | 10 layers |
| 4 | Quantization, routing, sorting, and dense support | smaller terms | mixed |
| outside graph | Argmax | 76.5 µs per step | sampling |
| outside graph | Largest add/neg kernels | about 131 µs per step | sampling support |
This profile set the work order: MoE first, then GDN, attention, and sampling. It also showed why generic labels are misleading. “Attention” covers short decode, grouped-query extension, target verification, and long-prefix split-sequence execution. “GDN” covers convolution, recurrent verification, state commit, accepted-prefix replay, and long-prefill initialization. Each path needs a distinct contract and sometimes a distinct algorithm.
The trace also exposed two qualitatively different failure modes. Some hot operators were bandwidth-bound because they wrote an intermediate that the next operator immediately reread. Others were parallelism-bound: their total arithmetic was small, but a row-wise mapping launched tens of workgroups on a GPU designed to sustain thousands of waves. The successful kernels therefore did not share one optimization recipe. They either removed bytes from the dataflow or changed the decomposition so that independent work became visible to the machine.
Long prefill produced a different ranking. For the 27B hybrid at input length 8,192, dense projections accounted for 61.60% of warmed wall time. For the 35B model, non-M768 MoE accounted for 19.63%, attention 11.01%, dense projections 11.45%, and GDN initialization 9.45%. A decode winner is not automatically a prefill winner; the deployment needs workload-specific tactics.
Compile exact contracts, not model names
Netra does not select a production kernel by model or operator name alone. It dispatches on the complete execution contract: the properties that determine whether a tactic is both correct and fast for this invocation.
| Contract class | Deployed examples | Why it changes the tactic |
|---|---|---|
| Geometry | batch, verification length, heads, experts, top-k, K/N/M | Controls tiling, occupancy, LDS use, and available parallel work |
| Representation and layout | BF16 or E4M3 FP8, scale granularity, strides, paged KV, route order | Changes conversion semantics, address calculations, and memory access |
| Execution and state | decode, target verification, state commit, graph replay | Similar shapes can have different masking, outputs, or side effects |
| Runtime ABI | pointer widths, workspace addresses, stream ownership, code object | Captured replay requires the expected binary and stable resources |
At runtime, the model frontend emits this signature and the tactic catalog checks it against prevalidated predicates. A complete match enables the specialized Netra implementation; any mismatch follows the established SGLang or AITER path. This is bounded dispatch, not online autotuning.
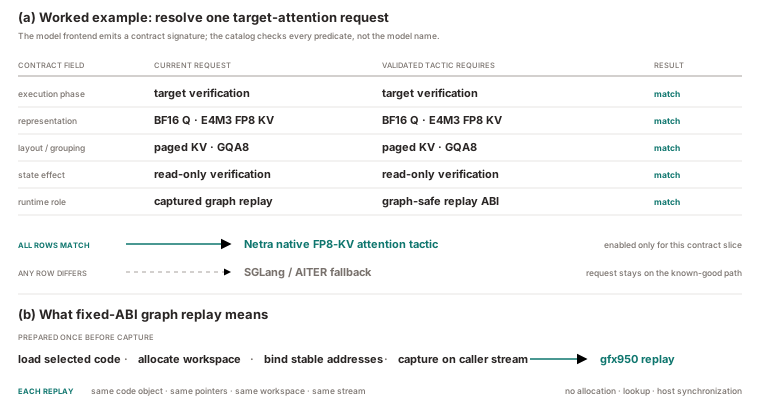
Before graph capture, the runtime loads the selected code, allocates persistent workspace, fixes pointer values, and records launches on the caller's stream. Replay then performs no allocation, symbol lookup, or host synchronization. A locally faster kernel that cannot satisfy those conditions remains on the fallback path, as several dense and general MoE candidates did. Implementation details are available in the compiler architecture, kernel contracts, and tactic authoring guide.
The baseline was correct, but it moved too much data
The profile identified the hot families, but an operator list did not explain why they were slow. The useful comparison was between the data the model required and the work the serving graph actually performed. That exposed four concrete problems before we wrote a replacement kernel.
Routed MoE wrote a BF16 activation to HBM only to reload and quantize it for the next projection, while route metadata crossed framework boundaries repeatedly. Grouped-query attention reread a shared FP8 KV prefix for separate query heads, and long-prefix verification assigned a 49,152-position scan to one workgroup. GDN verification materialized candidate-state trajectories before acceptance decided which prefix could commit. Sampling launched only sixteen row workgroups for nearly four million logits.
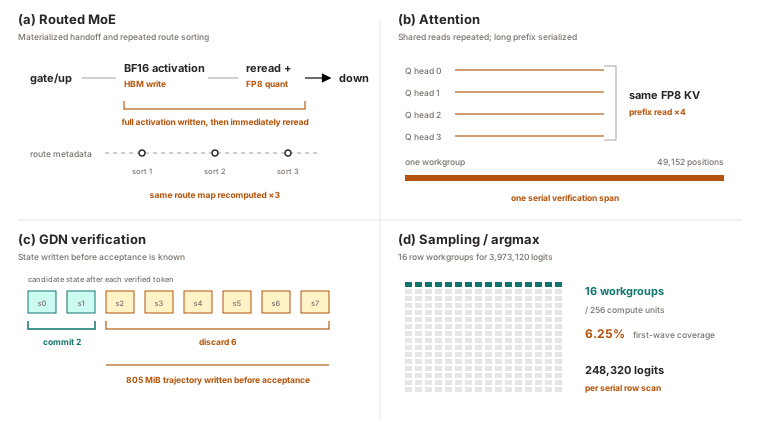
These were not four versions of the same kernel problem. They required four different transformations: remove an intermediate tensor, align reuse with GQA structure, separate temporary recurrence from state commit, and widen a reduction without changing its ordering semantics. The common mistake would have been to tune instructions inside the existing dataflow while leaving the dominant waste intact.
ROCm gfx950 kernel optimizations for Qwen3.6
The accepted kernel work follows four recurring ideas: eliminate redundant memory traffic, expose enough parallel work, reuse data according to the model's native grouping, and fuse only across boundaries that remain useful under graph replay.
Routed MoE: optimize the handoffs
For one token row, the deployed routed path selects 9 of 256 experts and then executes the following logical sequence:
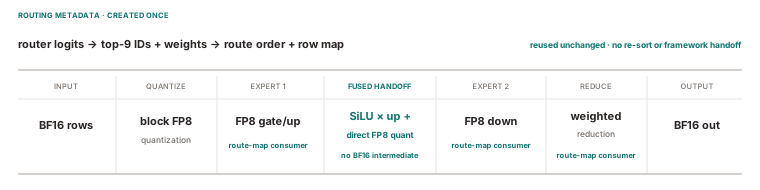
The expensive parts are not only the two expert GEMMs. The transitions between them contain many small kernels, materialized activations, scales, route maps, and framework dispatches. Those terms are disproportionately visible inside a captured decode graph.
Fusing the activation/quantization boundary
For the exact decode contract, the activation has 9 routed rows of width 512. The reference first computes
rounds through the deployed BF16 boundary, and then quantizes each contiguous 128-element block to E4M3 with its block scale. The original graph expressed activation and quantization as separate AITER operations. The raw gfx950 kernel reproduces that exact boundary in one launch: FP32 evaluation of the nonlinearity and product, the required BF16 rounding point, then E4M3 conversion and one scale per 128 values.
The mapping is intentionally simple: 9 wave64 workgroups, one routed expert row per workgroup. The compiled kernel uses 35 VGPRs and 27 SGPRs, no LDS and no scratch, and its hot body uses vectorized 128-bit loads and two output streams for values and scales. The 133-instruction kernel is small enough that the launch and the eliminated round trip matter as much as instruction count. It produced zero mismatches across all 4,608 FP8 values and all 36 scales.
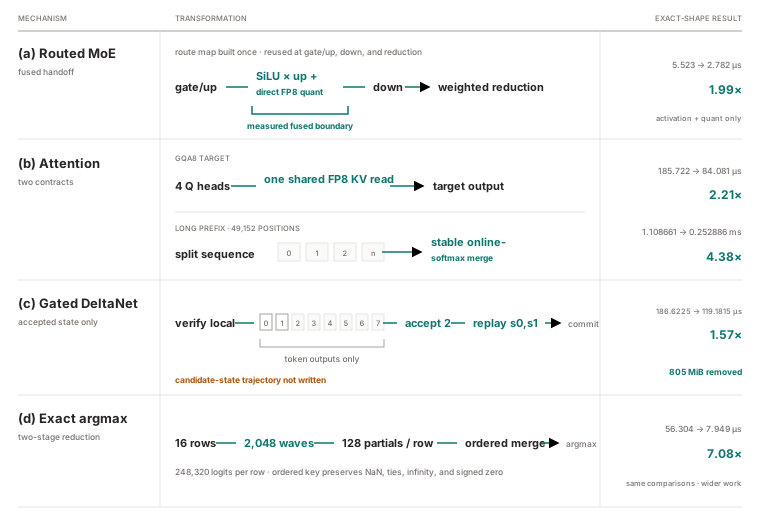
The fused kernel measured 2.782 µs versus 5.523 µs for the deployed-equivalent two-operation sequence, a 1.99× microkernel speedup. Across the 40-layer graph, replacing the activation and quantization nodes removed 5,120 launches per captured execution of the profiled workload. This structural count is more informative than a profiler's merged “GPU busy” sum, because adjacent graph nodes and timestamps can overlap in tool output. The accepted captured pipeline increased historical output throughput from 148.014 to 158.288 tokens/s in its measured scope. The eager path regressed 6.01%, so the tactic is explicitly graph-scoped rather than advertised as universally faster.
Reusing routing work instead of recomputing it
The shared expert gate originally crossed several framework boundaries: BF16 dot product, sigmoid, conversion/expansion of the scalar gate, route-map copy, and append of the shared expert into the sorted route stream. The fused kernel performs that sequence in one wave64 workgroup. It uses packed v_dot2_bf16 operations for the gate, a six-stage ds_bpermute reduction to make the scalar visible to the wave, and writes the route metadata directly in the layout consumed by the expert kernels. Measured kernel time was 5.96 µs.
More importantly, the integration reuses route metadata already known to the captured graph and bypasses redundant sorting. Across the full model, that removes 5,120 each of the small gate GEMVs, sigmoid/conversion steps, and shared-expert append operations. Full-graph serving improved 27.31%; piecewise graph serving improved 27.08%. This is the clearest MoE result: preserving the right metadata across an abstraction boundary was worth more than treating every visible operator as an independent kernel-tuning problem.
Matching matrix shape to the machine
The M1 expert projections use separate launch geometries for the two stages. The gate/up stage exposes 576 waves and executes 9,216 FP8 MFMA instructions; the down stage exposes 256 waves and executes 4,608 FP8 MFMAs. Counter runs reported 99.11% and 92.44% VALU utilization respectively, zero LDS bank conflicts, and no scratch allocation. The point is not that every shape needs handwritten assembly; it is that these small routed matrices require enough independent wave tiles and a bounded register footprint to occupy gfx950.
At natural C64 serving, an exact M768 contract appears: M=768, 257 experts including the shared path, top-9 routing, K=2048, and intermediate width
- The accepted design is a two-kernel split-K pipeline. A producer with
grid (2, 365, 1) computes two K partitions and writes FP16 partials; its 256-VGPR allocation and 64 KiB LDS footprint are deliberate consequences of holding the MFMA tile. A reducer with grid (16, 768, 1) and 28 VGPRs reads the two partials, applies route weights in FP32, follows the fixed reduction order, and emits BF16. The producer and reducer own explicit persistent workspaces and enter the captured graph as only two launches.
The best retained natural-output run with this tactic reached 11,517.22 output tokens/s.
Why the fallback remains essential
AITER still owns the general MoE path. In one exact M128 selector screen, an xBF16 candidate measured 161.53 µs versus 163.23 µs for the deployed operator but exceeded the configured FP8 reference-mismatch tolerance. A faulting flat-BF16 candidate was quarantined. For a missing long-prefill matrix M=8192, N=5120, K=2048, we screened 285 CK, CK-Tile, and assembly candidates; the existing CK tactic remained fastest at 144.6801 µs. A specialized catalog that can retain these fallbacks is stronger than a custom backend that must replace them.
Native FP8-KV attention: share what the model shares
Grouped-query attention (GQA) maps several query heads to one KV head. If the grouping factor is , then a per-query-head kernel may read the same prefix key and value times. For long native-FP8 caches, those loads dominate more readily than the score arithmetic. Our target kernel makes the KV group, rather than the query head, the unit of data reuse.
The deployed GQA8 contract is tightly bounded: BF16 query and output, native E4M3 prefix K/V, 16 query heads, 2 KV heads, head dimension 256, and batch no larger than 64. It also fixes the paged-cache ABI: 64-bit qo_indptr, 32-bit kv_indptr, 64-bit kv_indices, and the exact SGLang block layout. These details matter because a correct FP8 conversion over the wrong page stride is still a memory-safety bug.
One 512-thread workgroup covers four query heads sharing a KV head. Each KV head is handled by two query groups, so a sequence launches four workgroups in total. Native prefix-KV loads are shared by four heads instead of repeated by four per-head workgroups; the code object reserves 32 KiB LDS for its grouped schedule. The kernel preserves the reference's online-softmax order in blocks of 64 prefix positions. For one block with local maximum , normalization sum , and weighted value accumulator , the merge with the running state is
The final output is . This representation permits sequence blocking without materializing the score matrix and is also the basis of the split-sequence kernel below. The compiled GQA8 kernel uses 148 VGPRs, 80 SGPRs, 32 KiB LDS, and no scratch. The high register count is accepted because the 512-thread group creates the intended cross-head reuse; reducing registers by returning to one head per workgroup would increase HBM traffic.
At the exact captured shape, it measured 84.081 µs versus 185.722 µs for the Triton path, a 2.21× speedup. Integrated serving throughput improved 8.406%. Across 3,096,576 BF16 output elements, only 28 differed; the maximum absolute error was 0.0009765625 and cosine similarity was 1.0. The small difference comes from floating-point association in the online reduction, not from dequantizing the cache into a persistent BF16 copy.
The GQA4 extension contract is different: 32 query heads, 8 KV heads, head dimension 128, extension length at most 12, and a 256-thread workgroup. The retained batch-63 capture measured 145.442 µs. In the matched same-process comparison, raw measured 148.602 µs versus 209.562 µs for the deployed Triton kernel, 29.1% lower. Maximum error was 0.015625 with cosine similarity 0.99999994, repeated token tests and GSM8K-200 remained exact, and the recorded production run increased from 3,998.26 to 4,075.41 output tokens/s.
Split-sequence verification for long prefixes
Head grouping alone leaves one workgroup walking the entire sequence. At an exact 49,152-token prefix and M12 verification batch, that sequential loop underfills the device and creates a long tail. We instead partition the prefix into independent sequence slices. Stage one computes an online-softmax triple per slice; stage two merges the triples with the equations above. Because the merge rescales both partial sums by their maxima, it is numerically stable without writing an attention matrix.
The complete prepare + stage-one + stage-two path took 0.252886 ms versus 1.108661 ms for the sequential implementation: 4.38× faster and bitwise exact for the validated contract. The gain comes from turning one long serial walk into enough independent workgroups to occupy the GPU, not from performing fewer dot products. On an exact 32K-input/16K-output serving test, throughput improved from 4,170.22 to 4,311.37 output tokens/s, or 3.39%. This is a useful demonstration of Amdahl's law after a large local win.
A broad M <= 16 dispatch predicate once selected the GQA4 extension kernel during piecewise prefill. Its arithmetic was correct in its intended phase, but extension masking and cache side effects were not the prefill contract. We rejected the predicate and made graph phase a dispatch dimension. Shape alone is not a complete signature.
GDN: do not write state that nobody needs
The gated delta network is recurrent, so its optimization space is constrained by state semantics as well as tensor output. Abstracting away row/column orientation, one delta-rule step has the form
where and are normalized projections, is the decay, is the update gate, and is recurrent state. This notation is only the mathematical dependency graph; the deployed kernel also fixes the order of reductions and rounding. In a speculative server, target verification may compute several candidate positions without committing all of their states. A tactic must therefore distinguish output production, temporary recurrence, accepted-prefix replay, and state commit.
K0 verification: delete the unconsumed output
The M12 K0 contract covers batches 1–64 and a 12-token verification block with key width 128, value width 128, and value block width 16. Its preprocessing stage constructs normalized Q/K, decay, and beta in the layout required by the recurrent core. The key observation was liveness: the verification consumer needed the BF16 token outputs, but it did not consume a materialized full-state trajectory for every proposed position.
The selected core keeps the evolving state internal, writes only the BF16 output, and exposes state update as a separate contract. That removes roughly 805 MiB of global writes from the rejected full-state path at the validated shape. Disassembly provided a useful negative proof: the code contains no global_store_dwordx4 state-store sequence; only four global_store_short instructions for the required output remain. The kernel uses 80 VGPRs, 40 SGPRs, 1 KiB LDS, and no scratch. Across 3,145,728 checked output values it was exact.
The core measured 119.1815 versus 186.6225 µs for Triton, a 1.57× speedup, and the recorded serving order improved from 4,107.91 to 4,445.63 output tokens/s, or 8.22%. This is a dataflow win: most of the removed work is memory traffic that no downstream operator semantically required.
Causal convolution: encode the physical layout
The recurrent block is preceded by width-4 causal convolution. For the M12 contract the deployed tensors are not contiguous in the intuitive dimension:
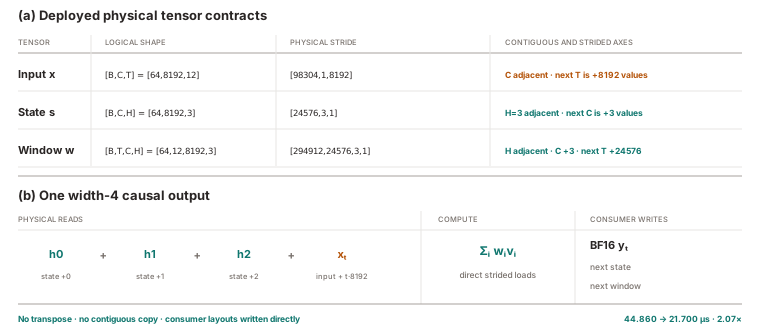
The gfx950 kernel maps the channel dimension across waves, reads the three history values and current input in their physical order, evaluates the four-tap convolution, and writes both output and the next state/window representations required by SGLang. The compiled kernel uses 33 VGPRs and 34 SGPRs with no LDS or scratch. Validation checked 6,291,456 output values, 1,572,864 final-state values, and 18,874,368 window values bitwise. It measured 21.700 versus 44.860 µs, 2.07× faster. Yet serving improved only 0.172% in the direct causal experiment because the source region represented about 0.46% of the step. This is an unusually clean example of a correct, large microbenchmark win with a small system effect.
M16 verification: arithmetic order is part of state
For B=1, T=16, H=16, H_v=32, K=128, V=128, the accepted path separates a precompute kernel from the recurrent core. Precompute variant 7 reconstructs the adjacent-lane vector layout, row-pair order, split-ln(2) log conversion, and subnormal exponential behavior used by the oracle. On gfx950 it also needs an s_nop 0 scheduling gap between exponential and ldexp; omitting that gap changes rare values. Recurrent-core variant 13 follows a residue-dependent Q reduction order. A cleaner uniform reduction was mathematically equivalent but caused one to four BF16 output mismatches in 13 layers because the FP32 association changed.
The accepted precompute uses 44 VGPRs and 48 SGPRs; the core uses 80 VGPRs, 40 SGPRs, and 1 KiB LDS. Both launch 256 wave64 workgroups at the captured shape, and the core's counter profile is 97.54% VALU-active. All 30 layers were bitwise exact over normalized Q/K, decay, beta, token output, and recurrent state. Precompute measured 6.12 µs, the core 18.44 µs, and the combined path 24.361 µs. Integrated short serving latency improved 2.32% and verification-call throughput improved 3.52–3.69%.
State precision as a capacity optimization
State precision changes the feasible batch envelope. On Qwen3.6-27B, storing recurrent state in BF16 while accumulating and replaying in FP32 reduced the state pool from 18.14 to 9.07 GB. This is not equivalent to performing the recurrence entirely in BF16: conversion occurs at the storage boundary while the sensitive update remains FP32. Five fresh C128 processes averaged 3,429.02 versus 3,287.81 output tokens/s, or +4.30%. The saved memory made a C192 throughput profile possible; it averaged 6,381.33 output tokens/s versus 5,710.44 at C128, with the expected TTFT and TPOT trade-off.
Sampling: make small batches large enough
Sampling appears small next to a model layer, but it sits on the serial path after verification and outside the captured graph. At [M=16, N=248320], the reference row-wise argmax launched one workgroup per row: only 16 workgroups for almost four million logits. Each workgroup then traversed a very long row, so the reduction was parallel within a workgroup but badly underfilled across the device.
Netra partitions each row into 128 chunks of 1,940 FP32 values. Stage one therefore launches 2,048 independent workgroups; stage two reduces the 128 partial winners per row. The transform changes neither comparison count nor global semantics. It changes the span of the computation from one long serial walk per row to a wide first stage and a tiny fixed second stage.
Exact PyTorch behavior required an ordered reduction key rather than an ordinary (value, index) maximum. NaN wins over every numeric value; the first NaN wins among NaNs; equal numeric values choose the lowest index; and +0.0 and -0.0 compare equal. We encode the comparison class and value order in the high bits and the bitwise complement of the index in the low bits, allowing a single associative max reduction while preserving the lowest original index. This makes the two-stage decomposition semantically identical to the row-wise oracle even for adversarial values.
Both raw stages declare 52 VGPRs and 20 SGPRs, no LDS and no scratch; stage one exposes 2,048 waves without LDS conflicts. Their function text totals 3,984 bytes versus 21,244 bytes for the prior path, an 81.25% smaller code footprint; we did not separately measure its instruction-cache effect. The complete result measured 7.949 versus 56.304 µs, 7.08× faster. In the serving trace it measured 12.306 versus 74.550 µs, saving 64.197 µs per verification call. It reproduced the oracle in 197 of 197 cases, including explicit NaN, tie, infinity, and signed-zero cases.
What the accepted kernels have in common
The kernels above look different, but their mechanisms fall into four classes:
| Mechanism | Deployed examples | Hardware consequence |
|---|---|---|
| Remove a tensor boundary | MoE SiLU+quant, GDN K0 no-state-output | Fewer global bytes and graph launches |
| Reuse according to model structure | GQA8 native-FP8 KV, shared route metadata | Fewer repeated HBM reads and framework handoffs |
| Increase exposed parallelism | split-sequence attention, two-stage argmax, split-K M768 MoE | Thousands of waves replace a few long-running workgroups |
| Freeze a narrow contract | graph-safe raw ABI, persistent workspaces, phase predicates | Specialized code survives capture without claiming unsafe shapes |
Low-level techniques such as MFMA tiling, vectorized loads, LDS staging, register budgeting, wave reductions, and explicit scheduling make each transformation fast on gfx950. The transformation itself determines whether the work should exist. This ordering matters: reducing the instruction count of a tensor that can be deleted is the wrong optimization target.
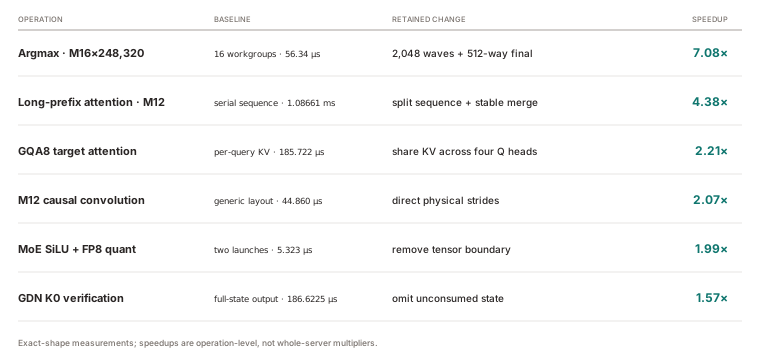
DFlash speculative decoding in SGLang
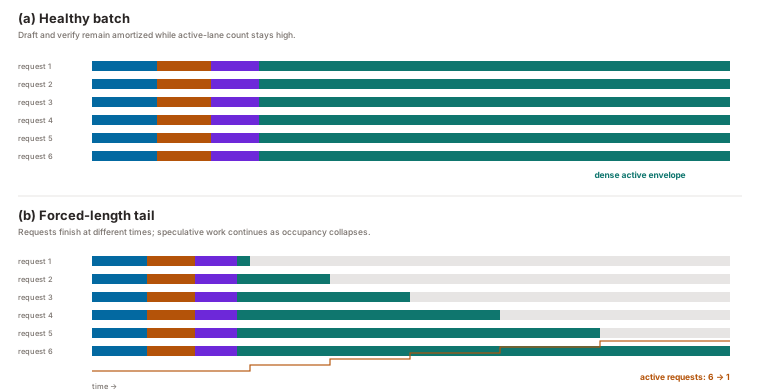
Speculative decoding wins only when accepted draft tokens repay draft generation, target verification, state replay, and tail-batch overhead. On a hybrid attention/GDN model, every accepted prefix also has recurrent-state semantics to preserve.
For a speculative iteration that proposes tokens and commits a random number , a useful first-order cost per committed token is
Increasing can amortize launch and target-model cost, but it also raises draft work, verification width, temporary recurrent-state work, and wasted computation after the first rejection. Near the end of a forced-length batch, some requests finish while others continue; graph batches shrink, specialized contracts stop matching, and the same block size can lose its steady-state advantage. This is why we tune DFlash jointly with graph batches and kernel contracts rather than maximizing an internal acceptance statistic.
The recurrent model adds a transactional requirement. Draft state is provisional. Target verification computes token outputs without globally committing every candidate state; selection determines the accepted prefix; then the server replays or commits exactly that prefix. The K0 no-output GDN kernel, M16 verification core, state-update tactic, and DFlash scheduler are therefore parts of one protocol. Optimizing one while violating the verify/commit boundary can return plausible current tokens and corrupt the next iteration.
We screened DFlash block sizes 8, 12, and 16 on the exact 1K-input/256-output DP1 workload:
| DFlash block | C1 output tok/s | C8 output tok/s | C1 mean TTFT | C8 mean TTFT |
|---|---|---|---|---|
| 8 | 415.47 | 1,843.05 | 35.80 ms | 65.23 ms |
| 12 | 455.42 | 1,886.80 | 36.55 ms | 67.15 ms |
| 16 | 436.75 | 1,744.43 | 37.34 ms | 68.66 ms |
Block 12 became the balanced throughput default. Block 16 remained the batch-one latency control on a separate exact 210-input/128-output prompt, where it measured 115.665 versus 139.921 ms median for block 12. At concurrency 32, target-only full graph still won the fixed-length saturation screen. The correct profile therefore depends on live batch pressure; speculation is not the unconditional default for every operating point.
The comparison with stock engines at C1 and C8 uses retained runs from the same random 1K/256 harness:
| Engine profile | C1 output tok/s | C8 output tok/s |
|---|---|---|
| Netra SGLang + DFlash block 12 | 455.42 | 1,886.80 |
| Base SGLang | 214.39 | 1,286.79 |
| vLLM | 84.27 | 587.69 |
At C1, Netra was 2.124× base SGLang and 5.404× vLLM. At C8, it was 1.466× and 3.210×, respectively. The advantage narrows as batching gives the target-only engines more useful work and speculative verification becomes a smaller part of the system difference.
The original C1/C8 campaign did not have a valid upstream SGLang DFlash arm, so we do not backfill one into that table. We subsequently validated the upstream DFlash path on the longer 1K/1K and 1K/8K contracts. Those fresh controls appear below, where their workload and stopping policy match the reported Netra results.
Quality still decides what ships
Every tested DFlash block (4, 8, 12, and 16) passed three identical uncached 210-input/128-output requests with the same full token-array SHA-256. We then ran the full 1,314-example, five-shot, thinking-disabled GSM8K evaluation at 64 client threads:
| Profile | Correct | Accuracy | Wall time | Output tok/s |
|---|---|---|---|---|
| DFlash block 12 | 1,254 / 1,314 | 95.4338% | 52.1496 s | 3,902.92 |
| DFlash block 16 | 1,254 / 1,314 | 95.4338% | 52.3475 s | 3,899.27 |
| Same-session target-only full graph | n/a | n/a | n/a | 1,055.30 |
| Retained coherent eager control | n/a | n/a | n/a | 973.46 |
Block 12 was 3.70× the same-session target-only control and 4.01× the retained coherent eager result. Both DFlash blocks returned the same accuracy.
The quality story still has a qualification. Long generated text was not byte-repeatable even between identical target-only runs because the AITER M>1 routed-expert prefill reduction could change the trajectory. Three of 100 extracted final answers changed in one repeated diagnostic, and SGLang's deterministic-inference flag did not remove it. We do not attribute that issue to DFlash and we do not waive it. Exact fixed-token gates pass; long-text byte repeatability remains a separate target-path limitation.
Single-GPU Qwen3.6 inference benchmark results
The low-concurrency comparison explains relative engine performance. The production throughput profiles show how much one MI350X can deliver when the server is allowed to batch deeply.
A clean 1K/1K comparison
On August 21–22, 2026, we reran the engines on one otherwise-idle MI350X. Each server started in a fresh process and served 384 random requests at concurrency 128, with exactly 1,024 input and 1,024 output tokens, temperature zero, seed 20260809, and prefix caching disabled. The Netra row is a direct restoration of the retained-best container contract: pinned image and server revision, historical launch environment, and hash-matched active kernel artifacts.
| Fresh exact 1K/1K run | Output tok/s | Netra speedup |
|---|---|---|
| Netra SGLang + DFlash, retained best | 11,161 | n/a |
| Base SGLang 0.5.16 | 7,330.23 | 1.52× |
| Stock SGLang 0.5.16 + DFlash | 5,658.28 | 1.97× |
| vLLM 0.26.0 | 4,684.51 | 2.38× |
All four runs completed 384/384 requests and reported exactly 393,216 input and 393,216 output tokens with zero client errors. vLLM's benchmark adapter accepted text prompts rather than SGLang's raw token-ID transport; server-side token accounting nevertheless reported 1,024 input and 1,024 output tokens for every request.
On this matched contract, Netra delivered 1.52× base SGLang throughput, 1.97× stock SGLang DFlash throughput, and 2.38× vLLM throughput. These are complete-server comparisons, including scheduling, graph execution, speculation where enabled, tokenization, and HTTP serving.
Natural-output serving
The best retained natural-output C64 run reached 11,517.22 output tokens/s on one MI350X.
Long generation: 1K input / 8K output
The best retained 1K/8K run reached 14,431.74 output tokens/s on one MI350X at concurrency 128.
The fast kernels that did not ship
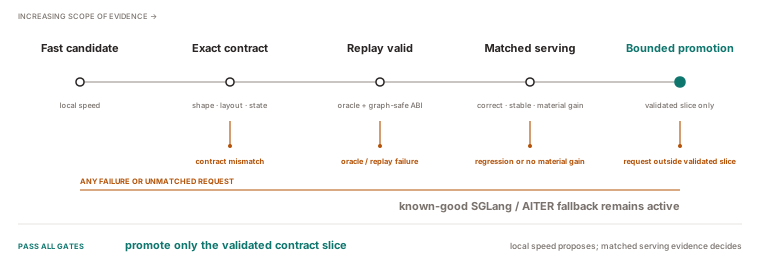
Microbenchmark latency does not predict serving performance, and correlation inside a large patch does not establish which kernel caused a gain. We used a progressively stronger evidence ladder:
- Contract oracle. Compare the candidate and deployed implementation on the exact shape, layout, dtype, state effect, and adversarial numerical cases before timing.
- Warm device timing. Separate code-object load and first-call setup from steady eager execution, then measure capture and replay separately.
- Single-tactic toggle. Hold the server image, checkpoint, workload, graph policy, and every other kernel constant while changing one dispatch predicate or binary.
- Order reversal. Use AB/BA or fresh-process repetition so thermal state, cache warming, and request randomness cannot systematically favor the candidate.
- Full-system invariants. Check completed requests, exact token counts, output hashes or bounded error, task quality, process stability, and the loaded bridge/code-object hashes.
The rejected experiments are evidence for why those layers are necessary:
| Candidate | Local result | Serving result | What the control showed |
|---|---|---|---|
| 27B QKVZ + convolution | 33.941 vs 44.141 µs, 1.30× | 3,307.72 → 3,206.81 tok/s | The exact local saving did not survive the integrated graph; the record does not isolate one cause |
| M8192 causal convolution | 1.496× | −5.60% | The long-prefill local ordering reversed in serving |
| Dense M768 projection | 115.441 → 110.121 µs | −6.40% | A faster projection was insufficient evidence for graph-level promotion |
| FMoE block candidate | +24.4% | +0.045% | The optimized block was not a material share of the natural workload |
| Frozen dense replacement | locally favorable | −0.94% in ABBA | Process order and integrated effects reversed the microbenchmark conclusion |
| Remove 48 prefill materializations | one warmed request +2.36% | natural C192 +0.026% | The target tensors were not important in the production request mix |
These are not merely “noise.” They demonstrate that a kernel-only benchmark omits integrated effects. Plausible mechanisms include changed graph topology or launch packing after fusion, shared cache and memory-controller pressure between adjacent kernels, and a shape distribution that differs from a trace slice. The retained data does not distinguish those explanations in every negative, so we do not claim that it does. We report an operation speedup as causal for the operation, and a matched server toggle as causal for the integrated path; we never infer the latter by multiplying the former by a call count.
Deployment consistency is another causal variable. A target-attention bridge with a larger batch guard is invalid unless the matching B128 code object is mounted. Likewise, a restored server is not the retained best if its replay bridge, router path, graph-batch set, or active binary hashes differ. The launcher rejects partial configurations, and the benchmark harness records the loaded artifacts from the live scheduler process. This discipline is what let us explain and discard the later 8.87K drifted run rather than treating it as a mysterious performance regression.
What transferred to the 27B model
The same contract and compiler architecture was applied to the 27B hybrid, which has different GDN geometry, a GQA6 attention contract, and a DFlash block-8 profile. This is a useful test of whether the design generalizes beyond one model label.
The retained Qwen3.6-27B current-best deployment averaged 6,500.89 output tokens/s across five fresh-process, natural-EOS GSM8K runs at concurrency 192, with 96.25% numeric accuracy, 6,595 completed requests, and zero request errors. This is a separate quality-bearing production workload, not a 1K/1K cross-model comparison, so we report it as the 27B deployment result rather than placing it on the 35B benchmark ladder.
In the current isolated DP1 campaign:
| Exact request | Netra median wall | SGLang/AITER control | Result |
|---|---|---|---|
| input 16 / output 1 | 59.086 ms | 74.501 ms | 20.65% lower |
| input 8,192 / output 1 | 409.187 ms | 421.226 ms | 2.86% lower |
Both arms produced identical output hashes in all 20 repetitions. The smaller long-prefill gain matches the profile: dense projection remained the dominant cost, and AITER was already the best validated implementation for many of those shapes.
The result was not universally positive. On Qwen3.6-35B input-16/output-1, the control measured 23.828 ms versus Netra's 24.951 ms, making Netra 4.71% slower. That negative is retained. The tactic system should make it easy to fall back, not force a custom kernel to win every cell.
From one fast engine to a fast service
The DP1 work establishes the numerator in the scaling equation: the useful output one complete engine can produce. DP8 introduces a different problem. Eight independent schedulers must remain inside the same optimized shape domain, receive equivalent work, and finish inside one global wall-clock window. The router, clients, CPU placement, graph buckets, and response format now determine how much of the kernel gain survives.
Eight-GPU MI350X scaling with SGLang data parallelism
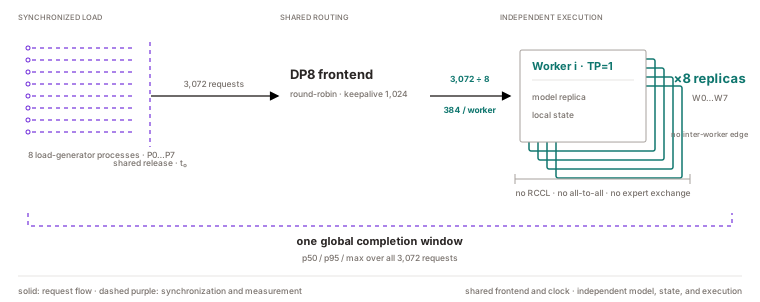
Our deployment uses data parallelism, not model parallelism. Each MI350X owns the complete model, its local KV cache, its recurrent state, its HIP graph instances, and an independent SGLang scheduler. Tensor parallelism is one. There is no all-reduce in attention, no all-to-all expert exchange, no pipeline bubble, and no RCCL or XGMI collective in the request path.
The public endpoint is intentionally thin. A frontend distributes requests to eight TP1 workers. For the production DFlash profile we use round-robin routing; for non-speculative profiles the launcher can retain least-connections routing. The DFlash benchmark repeats one exact per-worker corpus eight times and interleaves it so round robin delivers the same 384 requests to every worker. This removes corpus skew from the comparison while leaving real HTTP routing, connection reuse, response parsing, and worker queues in the measured path.
This topology makes ideal scaling look deceptively easy. If worker (i) produces tokens at rate (r_i), one might expect
That expression is useful as a ceiling, but it is not how a routed service is observed. The measured rate is
where (O_i) is the output-token count assigned to shard (i). The numerator adds useful work; the denominator includes the longest tail across all clients and workers. Summing eight independently reported throughputs would use eight different time windows and can overstate the rate. We instead synchronize the load generators, open a common measurement barrier, and close the interval only after the last measured response completes.
The resulting efficiency can be decomposed as
where the factors are descriptive rather than statistically independent. route covers proxy and connection overhead, client covers load-generation capacity, balance covers work distribution, and tail covers the slowest worker and request. Kernel optimization raises the (r_i); deployment work keeps the four efficiency terms from discarding the gain.
SGLang vs vLLM: the matched 1K/1K inference benchmark
The matched sweep is the cleanest view of engine fill. Every system receives the same random-content 1K/1K workload with prompt caching disabled and exact request and token checks. The default-SGLang control uses the stock image and default performance parameters; the benchmark-required radix-cache override is applied so cached work cannot enter the measurement. It reaches 23.38K at C512 and 23.72K at C1024: essentially a plateau.
The 23.72K plateau was a serving-configuration limit, not an MI350X limit. Larger scheduling capacity, appropriate graph buckets, memory allocation, and a workload-matched serving profile moved SGLang to 39.01K at C512 and 61.22K at C1024. This engine tuning was the first stage of our optimization work.
The second stage added Netra's kernels and runtime specialization. The full path reached 81.33K output tokens/s, compared with 61.22K after SGLang tuning, 37.67K for vLLM, and 23.72K for base SGLang.
The curve also explains why a single endpoint is insufficient. At global C1, one request occupies only one of eight workers; aggregate hardware utilization is structurally low. By C1024, the average worker can hold 128 running requests. That is exactly the upper contract for which we promoted the recurrent replay path and built graph coverage. Scaling emerges when the distributed load shape and the per-worker kernel envelope meet.
The batch-128 contract
The production worker is not a general “fast” mode. It is a bounded contract named dp8-throughput128. Its important properties are:
- a maximum of 128 running requests per worker;
- 65,536-token context capacity and 32,768 prefill tokens per batch;
- 80% static memory allocation for the serving pool;
- HIP graphs at batch sizes 1, 2, 4, 8, 16, 32, 64, 80, 96, 112, and 128;
- a two-step stream interval on the 1K/1K DFlash path;
- the gated BF16 router and exact M12 QKVZ/causal-convolution path; and
- the promoted state-replay artifacts for the full batch range 1 through 128.
The graph list is sparse by design. Dense capture of every integer batch size from 1 through 128 consumes more memory, increases startup work, and did not improve the retained server profile. The selected buckets cover scheduler phases and high-occupancy regions without turning graph capture itself into a capacity tax. Unsupported or intermediate shapes remain on guarded framework paths. Narrow graph coverage is not a weakness when the scheduler knows how to pad into proved buckets and the fallback remains correct.
The more delicate change was recurrent state replay. Qwen3.6 interleaves attention with gated delta network layers. During speculative verification, the target evaluates a fixed token block for every live request, then commits only the accepted prefix. For each recurrent head, the deployed update can be written as
Verification computes the token-local quantities, but the persistent state must advance only through the accepted prefix. Recomputing the entire model is unnecessary; blindly committing all verified tokens is wrong. Netra separates precomputation from state replay. The replay kernel walks the accepted prefix in the exact recurrent order, updates the matrix state, and advances the causal-convolution history under the same request-slot mapping.
For DP8 we extended that raw state-replay ABI from its earlier selected domain to every batch size 1–128. The host bridge passes the state capacity, not merely the live batch, because graph padding uses a sentinel slot that must be clamped away from every real request. The launch predicate requires one spare state slot and rejects unsupported query-start or token-index layouts. A mismatched ABI inside the promoted domain raises an error instead of silently falling back, because silent fallback during a captured high-throughput phase would make both performance and state semantics shape-dependent.
The proof was not “the output looks plausible.” We compared recurrent state and convolution state bit-for-bit through batch 128 in eager execution and HIP graph replay, for the one-, four-, and eight-wave replay schedules. Only after the complete state oracle passed did the dispatcher change its admitted range from selected batches to all of 1–128.
This detail matters at the service level. If the optimized state transition works at B64 and B96 but falls back at B80, B112, or B128, the scheduler can cross kernel families as load changes. The result is a jagged latency surface: a nominally small change in live requests causes a different implementation, more launches, and a longer graph. Across eight replicas, those discontinuities appear as tail amplification. A complete bounded ABI makes performance continuous over the operating envelope.
The kernel contract has to survive scaling
Once every worker receives enough requests, the local graph again becomes the dominant object. A representative batch-128 trace recorded 690 graph replays in ten seconds. The average synchronization wait was 12.781 ms per replay and host graph launch cost was 304 µs. Inside the graph, the major families were 5.506 ms of one-stage FP8 MoE work across 40 layers, 2.134 ms of packed GDN across 30 layers, and 1.648 ms of unified FP8-KV attention across ten layers. Argmax and its sampling support remained visible outside capture.
The Netra stack attacks those boundaries rather than replacing SGLang's scheduler:
Routed MoE. Exact-shape assembly kernels fuse activation, quantization, expert work, and reductions where the deployed layout permits it. The route contract fixes hidden size, intermediate size, expert count, top-k, token rows, scale layout, and accumulation semantics. Specialized M1 and verification paths remove launch and intermediate traffic; high-quality AITER paths remain the fallback when a predicate misses. On eight replicas, saved microseconds are replicated across eight independent graphs and dozens of MoE layers, but the benefit appears only if every worker stays in the admitted shape domain.
Native FP8 KV attention. Grouped-query heads share a smaller set of KV heads. Materializing or converting the cache for each query head repeats HBM traffic. The gfx950 kernels load native FP8 KV once per group, apply scales in registers, and merge split-sequence partials with online-softmax state ((m,\ell,o)). For segments (A) and (B), the stable merge is
The sequence split therefore raises parallelism without changing softmax semantics. The GQA8 and GQA4 paths use different fixed mappings; treating them as one generic attention kernel lost the memory-reuse opportunity.
GDN and causal convolution. Verification couples matrix recurrence to a small temporal convolution. The retained kernels keep the exact deployed arithmetic order, use request-local state, and fuse QKVZ projection with the M12 convolution where its layout is proved. The convolution state is a ring of recent activations, so its stride and wrap convention are part of correctness, not implementation trivia. State replay commits only accepted prefixes and leaves rejected suffixes without persistent effect.
Sampling. A row-wise argmax exposes too few workgroups on a 256-CU wave64 GPU. Netra encodes the framework's ordered comparison semantics into a parallel key, reduces partial winners in a first stage, and resolves the final winner in a second. That turns a serial-looking semantic operation into enough independent waves without changing tie or exceptional-value behavior.
The earlier kernel sections establish those mechanisms individually. DP8 adds a new requirement: a local optimization is useful only if it reduces the common tail. One worker falling into a generic replay branch can erase the gain from seven workers that stayed on the fast path. That is why exact dispatch predicates, graph-safe caller-owned workspaces, and complete batch-domain validation are scaling mechanisms, not merely software hygiene.
The frontend was initially measured through one Python event loop
After the B128 engine was stable, the direct-worker aggregate reached 81,570.36 output tokens/s. Sending the same 3,072 requests through the router with one load-generator process produced 75,206.34 output tokens/s. It would have been easy to attribute the 7.8% gap to Nginx or worker routing. That diagnosis was wrong.
The single Python event loop could not generate, parse, and retire 1,024 concurrent streaming requests quickly enough. The benchmark client had become the bottleneck. We split the load across eight client processes, pinned their CPU placement, and added a filesystem-backed measurement barrier. Each client prepared 384 requests at concurrency 128, announced readiness, and waited for the same release event. The summarizer then used the earliest start and latest finish across all eight result files.
The five routed results were 79,053.01, 80,091.10, 76,366.69, 80,575.97, and 80,855.65 output tokens/s, for a mean of 79,388.48. That is 5.56% above the single-client result and 97.33% of the synchronized direct-worker aggregate. All five runs completed every request, and round-robin routing delivered exactly 384 requests to each worker.
Nothing about the model became faster in this experiment. We changed the instrument that was supposed to reveal model speed. This is a recurring problem in high-throughput inference: once the server approaches 80K output tokens/s, a convenient asynchronous client can become a hidden serial stage. A load generator must be profiled and scaled like any other part of the system.
The frontend also received mundane but necessary production settings: eight Nginx workers, 16,384 worker connections, a keepalive pool of 1,024, and a 1,048,576 file-descriptor limit. Each model worker gets 14 physical CPU cores plus their SMT siblings. GPUs 0–3 are placed with NUMA node 0; GPUs 4–7 with NUMA node 1. These settings prevent unrelated host activity and socket limits from appearing as GPU variance. They are not presented as kernel gains.
Round robin was chosen for the DFlash measurement because the corpus and worker capacity were identical. A least-connections router makes a decision from a lagging signal: a worker that finishes a few requests early receives more work, changing its future batch shapes and possibly reversing the advantage. That feedback can magnify small runtime differences into request skew. Round robin gives each engine the same count and sequence under this controlled benchmark. Least connections remains useful for heterogeneous or non-speculative traffic; it simply answers a different scheduling problem.
At 8K output, response serialization overwhelmed the proxy
The 1K/1K profile was not the only DP8 campaign. We also forced 1,024 requests to produce exactly 8,192 output tokens each, for 8,388,608 output tokens in total. The GPUs were busy, the workers were balanced, and host CPU utilization was only 10.2%. Yet the public endpoint delivered 55,143 output tokens/s while the original direct-worker aggregate reached 61,556.
The bottleneck was the representation of a streaming response. The original path emitted the complete cumulative output_ids list after every generated token. If a request produces (L) tokens, the number of IDs serialized is
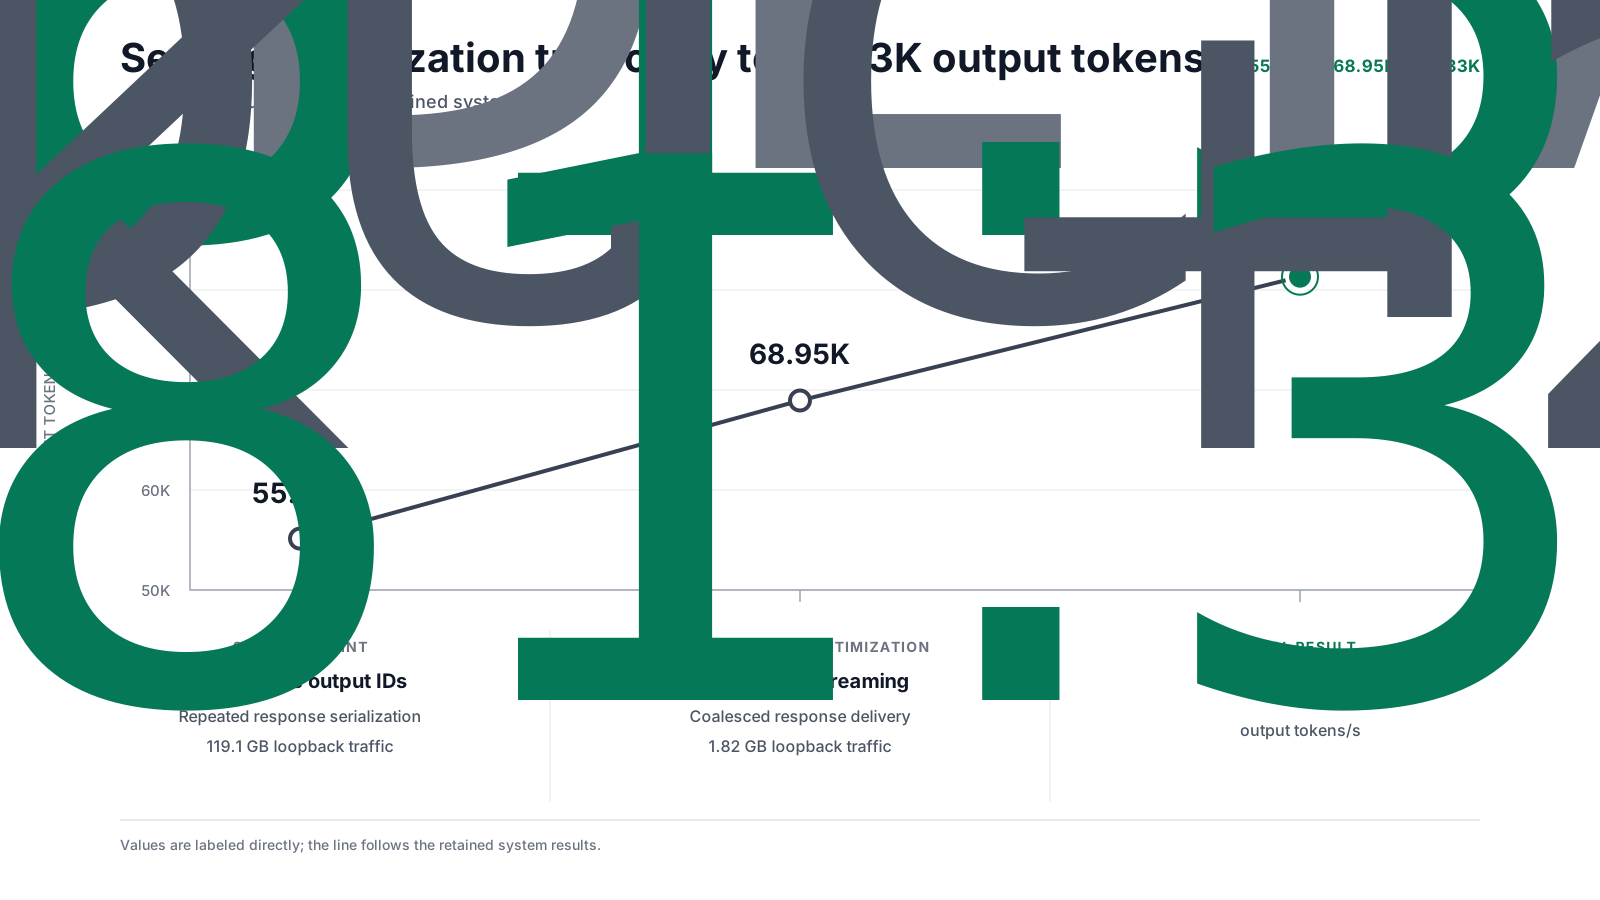
At (L=8192), that protocol repeated roughly 33.6 million token IDs per request before JSON and transport overhead. Across the DP8 run it moved 119,111,548,478 bytes over loopback, or 119.1 GB to communicate 8.39 million new IDs.
We changed the stream to emit only the newly generated suffix. The exact-token client reconstructs the logical output whether the server sends cumulative or incremental events, so the request result is unchanged. Incremental streaming reduced loopback traffic, and coalescing four decode steps per event reduced it again to 1.82 GB. Measured throughput rose from 55,143 to 68,948 output tokens/s, with 98.5% fewer loopback bytes and 25.0% more throughput. The final retained production profile reached 81,331.51 output tokens/s.
This was not an invitation to increase batching indefinitely. Stream interval 8 measured 0.34% below the retained interval-4 control, and increasing the notification batch from 16 to 64 lost 0.46%. Larger chunks reduce event overhead but delay visibility, perturb scheduler/consumer timing, and provide diminishing byte savings once the representation is already linear. We kept the smallest setting that achieved the plateau.
The profile also falsified several plausible explanations. Mean gfx activity was 96.8% across eight GPUs, mean UMC activity was about 35%, the host used about 10.2% of its CPU capacity, and each worker consumed roughly 2.5 cores. There was no RCCL traffic to optimize. After incremental streaming, the proxy penalty disappeared. The evidence pointed to serialization volume, not HBM, NUMA, or collective communication.
This finding belongs in a kernel article because it sets the boundary of kernel optimization. Once the graph is fast, bytes created by the API can cost more than bytes created by an operator. The useful performance model is
and the largest term changes as the others shrink.
81.33K on eight MI350X GPUs
Netra reached 81,331.51 output tokens/s on the production 1K/1K profile. The run completed 3,072 requests at global concurrency 1,024 and emitted exactly 3,145,728 output tokens through the production frontend.
What did not work
The path to the retained profile included fast local results that failed to improve the service.
A dense graph list covering every batch from 1 through 128 was less attractive than the sparse promoted set. It increased capture and memory cost without a repeatable serving gain. The lesson was not that more graph coverage is bad; it was that graph coverage should follow scheduler occupancy, not numerical completeness for its own sake.
Several response settings passed correctness and still lost performance. Stream interval 8 and notification batch 64 both reduced the event count, but neither beat interval 4 with the default notification batch. Once cumulative serialization was removed, additional coalescing was no longer the dominant lever.
The first routed benchmark used one asynchronous client and understated the server by 5.56% relative to the synchronized eight-client mean. More server tuning would not have fixed a saturated load generator.
In the long-output campaign, a speculative profile improved its own draft behavior after the native grouped-query attention and recurrent replay work, yet remained slower than the non-speculative deployment for that exact 1K/8K contract. We kept it available but did not make it the throughput default. Speculation adds draft computation and verification; it wins only when the saved target steps exceed those costs for the actual output distribution.
Finally, a locally faster MoE selector was rejected because its reference mismatch exceeded the configured FP8 tolerance. The fastest acceptable non-xBF16 candidate was already the deployed AITER choice. The absence of a new kernel promotion is itself useful evidence: the bottleneck had moved, and the correct next optimization was the response path.
Negative controls protect the story from hindsight. We did not begin with a claim that every layer needed custom assembly and then select only supporting measurements. We followed the critical path, tested mechanisms, and retained the stock implementation whenever it was safer or faster.
AMD GPU LLM inference optimization: a practical model
The DP8 work suggests a four-layer optimization model.
First, fill the engine. Set request capacity, memory fraction, context limits, and graph buckets so one worker reaches useful batch shapes. This moved SGLang from 23.72K to 61.22K.
Second, specialize the graph's true boundaries. Remove intermediate traffic, preserve native FP8 layouts, increase parallelism in small reductions, and split recurrent verification from accepted-prefix commit. Every specialization needs a predicate over shape, stride, dtype, state effect, and graph phase. This moved throughput from 61.22K to 81.33K.
Third, make the admitted domain continuous. A production scheduler does not remain forever at one ideal batch. Graph buckets and state replay must cover the complete operating envelope, with tested fallback outside it. Discontinuities become long tails when multiplied across replicas.
Fourth, scale the measurement and response plane. One common timing window, enough client processes, deterministic load distribution, linear-size token streaming, connection reuse, file-descriptor capacity, and NUMA-aware placement are required to observe and preserve the GPU gain. At 8K output, changing the response representation produced a larger service improvement than any available kernel candidate.
Together, these four layers turn one fast kernel into a fast service: fill the engine, specialize the hot dataflow, cover the scheduler's full operating range, and keep the request and response path out of the way.
Benchmark methodology: throughput, latency, and exact tokens
Serving runs
The headline relative comparison used:
| Setting | Value |
|---|---|
| Hardware | 1 × AMD Instinct MI350X (gfx950) |
| Topology | TP1 / DP1 |
| Model | Qwen3.6-35B-A3B-FP8 |
| Weights | FP8 E4M3, 128×128 blocks |
| Target KV cache | FP8 E4M3 |
| Workload | random 1,024 input / 256 output tokens |
| Concurrency | 1 and 8 |
| Requests | eight per concurrency slot |
| Prefix cache | disabled |
| Netra profile | piecewise graph, DFlash block 12, no-buffer Mamba scheduler |
| Baselines | base SGLang 0.5.16 and vLLM 0.26.0, no speculative decoding |
The base and stock-DFlash SGLang image was lmsysorg/sglang:v0.5.16-rocm720-mi35x at digest prefix 54ac680bad18. The vLLM image was vllm/vllm-openai-rocm:v0.26.0 at digest prefix 5709fafe4712. All arms used the same target checkpoint and benchmark client; the stock-DFlash arms additionally mounted the same unquantized draft checkpoint and used block size 12 with a 4,096-token draft window. The retained baseline notes report that SGLang selected AITER for FP8 MoE, while vLLM used Triton and lacked MI350-specific FP8/MoE tuning tables in that image.
The 1K/1K, natural-output C64, and 1K/8K profiles use their stated request contracts, stopping policies, and concurrency settings.
We define output throughput as the sum of server-reported generated tokens divided by client wall time from the first submitted request until the last completed response. TTFT is measured per request from submission to first token, and TPOT over subsequent token intervals. We report output rather than total tokens/s because prefill and decode have different computational cost and because speculative engines can perform internal work that is not emitted to the client. Completed-request and exact aggregate-token checks prevent an early stop, server error, or truncated response from appearing as higher throughput.
Measured servers pass health and warmup gates before traffic begins. The retained profiles pin the image, server revision, launch environment, and active kernel and bridge hashes. All reported single-GPU comparisons use an otherwise-idle MI350X.
Eight-GPU serving runs
The DP8 runs used eight independent DP1/TP1 workers behind one frontend, exact 1,024-input/1,024-output requests, disabled prefix caching, and global concurrency up to 1,024.
The production profile used 3,072 requests at global concurrency 1,024. The routed-frontend study used eight synchronized client processes and the same earliest-start/latest-finish denominator across their result files. Round-robin routing delivered exactly 384 requests to every worker. The 1K/8K response-path campaign completed 1,024 requests and exactly 8,388,608 output tokens; byte counts came from the measured loopback interface rather than an estimate from payload shape.
Kernel runs
Kernel measurements use the exact captured shape and deployed-equivalent reference. We do not extend them to other dtypes, layouts, batches, or graph phases without a separate validation. Warm measurements exclude code-object loading and one-time workspace construction. Where graph behavior is relevant, the candidate is measured both as an eager launch and as the exact captured node sequence; these are separate results because graph launch amortization can reverse the ordering.
Correctness testing is consumer-specific. State-producing recurrent kernels and argmax require bitwise or semantic equality. Attention permits a bounded BF16 difference only after checking maximum error, cosine similarity, repeated tokens, and the integrated quality gate. We inspect compiler resource metadata for VGPR, SGPR, LDS, and scratch allocation, and use disassembly or counters only to support a stated mechanism. Counter totals are not converted into bandwidth claims unless the collection semantics justify that conversion.
The internal retrospective report and runbook define the full evidence boundary and reproduction protocol used by this article.
What these results do not claim
The study has five important limits. First, it covers MI350X/gfx950 and the listed Qwen3.6 contracts; it does not claim the same instruction schedule or tactic ranking for another GPU. Second, the strongest whole-server numbers combine kernel, scheduler, graph, and speculative-decoding changes. We isolate individual mechanisms where a matched toggle exists and otherwise state only the combined result. Third, vLLM accepted text prompts while the SGLang client could send raw token IDs; exact server-side lengths matched, but frontend overhead is still part of the complete-engine comparison. Fourth, the original low-concurrency campaign lacks a valid stock-SGLang-DFlash arm, so that comparison is made only in the newer matched 1K/1K and 1K/8K campaigns. Fifth, target-path routed-expert reductions can make long generated text non-byte-repeatable even when quality is unchanged; fixed-token equality and GSM8K do not prove determinism for every prompt.
Finally, these are measurements on either one accelerator or eight independent DP1 replicas, as each result states; they are not hardware peak claims. They establish reproducible performance for the recorded software and model stack. Power efficiency, mixed-tenant latency, model-parallel deployments, and other model families remain separate questions.
What the bottlenecks taught us
The final service is fast because its boundaries agree. The scheduler admits shapes covered by the graphs. The graphs call kernels whose ABIs include every layout, arithmetic, and state invariant. Recurrent replay spans the complete batch-128 operating domain. The router gives each replica equivalent work. The clients generate enough traffic to expose the server. The summarizer uses one global window. The response path sends each new token once instead of serializing its entire history.
On one MI350X, that discipline produced 11.16K output tokens/s on exact 1K/1K and exposed why local kernel timings alone were insufficient. Across eight MI350X GPUs, engine tuning moved SGLang from 23.72K to 61.22K, and the full Netra path reached 81.33K.
The most useful result is that the number survives decomposition. We can show what came from filling the SGLang engine, what the exact-shape kernel stack added next, how much survived HTTP routing, where long-output serialization became dominant, and which apparently fast kernels failed the complete-server test.
That is the standard we want for high-performance inference: not merely a large peak, but a result that is attributable, bounded, reproducible, and honest about every fallback still doing useful work.
Netra Kernel FAQ
What is Netra Kernel?
Netra Kernel is an MIT-licensed open-source AMD GPU kernel repository. It publishes hand-written AMDGCN compute kernels, ROCm runtime bridges, validation harnesses, build and profiling tools, and retained positive and negative measurements.
Does Netra Kernel support AMD Instinct MI350X?
Yes. The gfx950 target covers Qwen3.6 FP8 inference paths on AMD Instinct MI350X, including FP8 projections and MoE, attention, GDN, normalization, routing, verification, and sampling. Each path remains bounded to its documented shape, dtype, layout, and numerical contract.
Does Netra Kernel replace SGLang or vLLM?
No. Netra Kernel supplies target-specific kernels and thin runtime bridges. Exact guards select a validated Netra tactic; unsupported contracts continue through the serving framework's established implementation. This article measures the kernels inside an optimized SGLang service and reports vLLM as a matched engine reference.
How does Netra Kernel integrate with SGLang?
Shape, dtype, and layout guards dispatch through a C ABI and HIP module bridge to a preloaded target-specific code object. Repeated launches preserve caller-owned streams and graph-capture behavior, without allocation, filesystem access, symbol lookup, or host synchronization on the launch path.
Acknowledgements
We thank AMD and ASRock for providing the 8× AMD Instinct MI350X system used for Netra's research and development. We also thank the SGLang, AITER, ROCm, and broader open-source inference communities whose software and engineering foundations made this work possible. All benchmark results and interpretations in this post are Netra's measurements, not AMD or ASRock product-performance claims.